Progetto Italia Federale |
|
|
a questo indirizzo di posta elettronica |
|
July, 2000
Revised Version
C:/Studien/Pfusch/ShadEcWorldbank.doc
Friedrich Schneider**)
Abstract:
Using various methods estimates about the size of the shadow economy in 76 developing, transition and OECD countries are presented. The average size of the shadow economy (in percent of official GDP) over 1989-93 in developing countries is 39%, in transition countries 23% and in OECD countries 14.1%. The average size of the shadow economy labor force (in percent of the official labor force) of the year 1997/98 in 51 developing countries is 50,1%, in 9 transition countries 49,0% and 7 OECD-countries 17,3%. An increasing burden of taxation and social security contributions combined with rising state regulatory activities are the driving forces for the growth and size of the shadow economy (labor force). |
*) An earlier version of this paper has been presented at the Worldbank Summer Research Workshop on Market Institutions, Worldbank, Washington D. C., July 17-19, 2000.
**) Professor of Economics, Dr. Friedrich Schneider, Department of Economics,
Johannes Kepler University of Linz, A-4040 Linz-Auhof, Austria. Phone:
0043-70-2468-210, Fax: 0043-70-2468-209. E-mail: friedrich.schneider@jk.uni-linz.ac.at,
http://www.economics.uni-linz.ac.at/Members/Schneider.htm
.
1 Introduction
2 The Definition of a Shadow Economy: An
Attempt
3 The Size of the Shadow Economies all
over the World Findings for 76 Countries
As crime and other underground economic activities (including shadow
economic ones) are a fact of life around the world, most societies attempt
to control these activities through various measures like punishment, prosecution,
economic growth or education. Gathering statistics about who is engaged
in underground (or crime) activities, the frequencies with which these
activities are occurring and the magnitude of them, is crucial for making
effective and efficient decisions regarding the allocations of a countrys
resources in this area. Unfortunately, it is very difficult to get accurate
information about these underground (or as a subset shadow economy) activities
on the goods and labor market, because all individuals engaged in these
activities wish not to be identified. Hence, the estimation of the shadow
economy activities can be considered as a scientific passion for knowing
the unknown.
Although quite a large literature) on single aspects of the hidden economy exists a comprehensive survey has just been written by Schneider (the author of this paper) and Enste concentrating on the size of the shadow economy in terms of value added. Moreover, the subject is still quite controversial) and there are disagreements about the definition of shadow economy activities, the estimation procedures and the use of their estimates in economic analysis and policy aspects.) Nevertheless around the world, there are strong indications for an increase of the shadow economy. The size, the causes and the consequences are different for different types of countries, but there are some comparisons that can be made and that might be interesting for social scientists, the public in general, and helpful for politicians, who need to deal with this phenomenon sooner or later. These attempts of measurement are obviously very difficult, since the shadow economy activities are performed exactly to avoid official registration. Moreover, if you ask an academician, a public sector specialist, a policy or economy analyst, or a politician, what the shadow economy is all about, or even how big it is, you will get a wide range of answers.
The scientific fascination of the underground economy has inspired me
to tackle this difficult question and undertake the challenging task of
collecting all available data on the shadow economy, and finally provide
some insights about the main causes of the shadow economy and its effect
on the official economy. In section 2 an attempt is made to define the
shadow economy. Section 3 shortly presents the empirical results of the
size of the shadow economy over 76 countries all over the world. Section
4 presents first and preliminary empirical results of the size of the shadow
economy labor force (informal employment) over 60 countries all over the
world. Section 5 examines the main causes of the shadow economy. In section
6 the various methods to estimate the size of the shadow economy are shortly
presented, and in section 7 a summary is given and some conclusions are
drawn.
Most authors trying to measure the shadow economy face the difficulty of how to define it. One commonly used working definition is: all currently unregistered economic activities which contribute to the officially calculated (or observed) Gross National Product.) Smith (1994, p. 18) defines it as market-based production of goods and services, whether legal or illegal that escapes detection in the official estimates of GDP." As these definitions still leave open a lot of questions, table 1 may be helpful for developing a better feeling for what could be a reasonable consensus definition of the legal and illegal underground or shadow economy.
From table 1 it becomes clear that the shadow economy includes unreported income from the production of legal goods and services, either from monetary or barter transactions - hence all economic activities which would generally be taxable were they reported to the state (tax) authorities. In general, a precise definition seems quite difficult, if not impossible as the shadow economy develops all the time according to the 'principle of running water': it adjusts to changes in taxes, to sanctions from the tax authorities and to general moral attitudes, etc." (Mogensen, et. al. 1995 p. 5). This paper does not focus on tax evasion or tax compliance, because it would get to long, and moreover tax evasion is a different subject, where already a lot of research has been underway.)
Table 1: A Taxonomy of Types of Underground Economic Activities1)
|
|
|
|
||
| Illegal Activities | Trade with stolen goods; drug dealing and manufacturing; prostitution; gambling; smuggling and fraud | Barter of drugs, stolen goods, smuggling etc. Produce or growing drugs for own use. Theft for own use. | ||
| Tax Evasion | Tax Avoidance | Tax Evasion | Tax Avoidance | |
| Legal Activities | Unreported income from self-employment; Wages, salaries and assets from unreported work related to legal services and goods | Employee discounts, fringe benefits | Barter of legal services and goods | All do-it-yourself work and neighbor help |
1) Structure of the table is taken from Lippert and Walker (1997, p. 5) with additional remarks.
For single countries and sometimes for a group of countries (like
the OECD or transition countries) research has been undertaken to estimate
the size of the shadow economy using various methods and different time
periods. In tables 2 to 4, an attempt is made to undertake a consistent
comparison of estimates of the size of the shadow economies of various
countries, for a fixed period, generated by using similar methods which
will be discussed in chapter 6 ), by reporting the results for
the shadow economy for 76 countries all over the world for the periods
198990 and 90-93.)
The physical input (electricity) method, the currency demand and the model approach are used for the developing countries. The results are shown in table 2. The physical input (electricity), the currency demand and MIMIC methods are used for Central and South America. In Africa, the results from eight countries are reported. Nigeria and Egypt have the largest shadow economies with 76.0 percent and 68.0 percent of GDP, the smallest is Mauritius with 20 percent. Applying the currency demand approach, Tanzania had a shadow economy of 31.0 percent (of GDP) in 198990 and South Africa, a western type industrial country, had a shadow economy of 9.0 % in 89-90.
For Central and South American countries, I have two estimates - one
using the physical input method (Lackó (1996)) and one from the
MIMIC approach (Loayza (1996)). For some countries, the estimates of the
size of the shadow economy are quite similar, such as Venezuela, Brazil,
and Guatemala. For others there are great differences, e.g., Panama, Peru,
and Mexico. Using the MIMIC approach for a ranking of the South American
countries, the biggest shadow economies can be found in Bolivia with 65.6
percent of GDP, Panama with 62.1 percent, Peru with 57.4 percent, and Guatemala
with 50.4 percent. The lowest can be found in Costa Rica with 23.2 percent,
Argentina with 21.8 percent, and Chile with 18.2 percent (all over the
period 199093). In Asia, Thailand ranks number one with 71.0 percent followed
by the Philippines with 50 percent and Sri Lanka with 40 percent. Hong
Kong and Singapore have the lowest shadow economy with 13 percent GNP.
In general the sizes of the shadow economies of some developing countries
are quite large and one may ask, what is really measured here. I would
argue it is more a "parallel" or second economy, which has not been adequately
captured by official statistics.
Sources: Own calculations values for developing countries in Africa and Asia from Lackó (1996, table 18). For Central- and South-America from Loayza (1996). A slash means that there exists no value for this period for this country.
1) Source: For South Africa: Van der Berg (1990) and Hartzenburg and Leimann (1992); they used the currency demand approach.
2) Source: For Tanzania Bagachwa, and Naho (1995, p. 1394), they used the currency demand approach.
3) For Mexico Pozo (1996) estimates the size of the shadow economy (in % of GDP): 33.0% (1989-90) and 35.1% (1990-93) using the currency demand approach.
4) Own calculations using the absolute figures of Bhattagharyya (1999).
5) For Taiwan the income discrepancy method is used also
for South Korea for 1990-93. Source Yoo and Hyun (1998).
The physical input (electricity) method has been applied to the
transition countries in Central and Eastern Europe and to states of the
former Soviet Union. The results are shown in table 3; they cover the periods
1990-93 and 1994-95. Considering the physical input method by Johnson et.
al (in brackets the Lacko values) and the countries of the former Soviet
Union over the period 199093, Georgia has the largest shadow economy with
43.6 (50.8) percent of GDP, followed by Azerbaijan with 33.8 (41.0) percent
and Moldova 29.1 percent. Russia can be found in middle with a shadow economy
of 27 (36.9) percent. According to the Johnson et. al. Figures Belarus
with 14 percent and Uzbekistan with 10.3 percent have the smallest values.
Except Uzbekistan (only for the Johnson figures) all other former Soviet
Union countries experienced a strong increase in the shadow economy from
an average of 25.7 (Lacko value: 34.9) percent for 1990-93 to 35.3 (Lacko
value: 43.6) percent for 199495, calculated over all 12 countries of the
former Soviet Union. Turning to the transition countries of Central and
Eastern Europe and considering the period 1990-93 and the Johnson et. al.
figures Hungary has the largest shadow economy with 30.7 percent of GNP
followed by Bulgaria with 26.3 percent. The lowest two are the Czech Republic
with 13.4 percent and Slovakia with 14.2 percent. Considering the Lackó
figures Macedonia has the largest shadow economy with 40.4 percent, followed
by Croatia with 39.0 percent. According to Lackó the lowest two
are Slovenia with 28.5 percent and the Czech Republic with 28.7 percent.
Whereas for the former Soviet Union countries a strong increase over the
two periods 1990-93 and 1994-95 has been observed, the average size of
the shadow economy of Central and Eastern European states was almost stable
over these two periods. The Johnson et. al figures show an average shadow
economy of the Central and Eastern European states of 20.6 (Lacko 32.4)
over 1990-93 and over the period 1994-95 Johnson et. al. shows an average
size of the shadow economy of the Central and Eastern European states of
20.9 (Lacko 31.6).
For the 21 OECD western-type countries either the currency demand
method or the DYMIMIC method were used; the results are shown in table
4. Considering the periods 1989/90 and 199093 the southern European countries
have the largest shadow economies: Greece (27.6 and 24.9%), Italy (22.8
and 24.0%), Spain (16.1 and 17.3%), and Portugal (15.9 and 17.2%). At the
lower end are the USA (6.7 and 8.2%), Switzerland (6.7 and 6.9%), and Austria
(6.9 and 7.1%). In general, this ranking of the size of the shadow economies
of the OECD countries calculated by Schneider is supported by other studies.)
Sources: Own calculations using values of Johnson, Kaufmann, and Shleifer (1997, table 1, p. 182-183), Johnson, Kaufmann, and Zoida-Lobatón (1998a, p. 351) and for the values in ( ) Lacko (1999, table 8).
1) For the former Soviet Union in the column 1989/90 only data for 1990 was available using the source from Johnson et.al. (1997).
2) For Croatia see Madzarevic and Milkulic (1997, table
9, page 17), they used the discrepancy method.
Sources:Currency demand approach own calculations and Schneider (1994a, 1998a).
1) The Figures are calculated using the MIMIC-method and Currency demand approach. Source Giles (1999b).
2) The figures have been calculated from Mauleon (1998).
In table 4, the latest results are shown for OECD countries over the
period 1994-95, and for the period 1997-98, too. In principle the ranking
of the sizes of the shadow economies of the results are similar to the
periods 1989/90 and 1990/93. However, the shadow economy has increased
compared to the results of the periods 1989/90 and 1990-93, in all OECD
countries: whereas the average size of the shadow economy of the investigated
OECD countries was 13.2 percent of the GDP in 1989/90 and 14.3% of GDP
in 1990-93, this value increased to 15.7 percent of GDP in the years 1994-95.
A further increase can be observed for the investigated OECD countries
to 16.8 percent for the period 1997/98. From these results it is
obvious that even in the late nineties the shadow economy is still growing
in most OECD countries.
|
(Estimation methods) |
1989-93 |
|
|
(Electricity method) Africa Central and South America Asia |
43.9 38.9 35.0 |
(9.4)1) |
|
(Electricity method) Former Soviet Union Eastern Europe |
25.7 20.7 |
34.92) 32.42) |
|
(Electricity Method) (Currency Demand Method) |
14.2 |
|
1) Value of South Africa.
2) Using the values from Lackó (1999) over 1990-93.
A comparison of the size of the shadow economy between the various countries and types of countries is very difficult and only a crude" comparison can be made, because in the various studies (i) different independent variables (e.g., tax variables) and (ii) different specifications of the dependent variable and of estimation equations were used; (iii) different assumptions about the velocity of currency are made, and (iiii) different additional influences on the electricity consumption were used. As can be seen from the table 6 the developing countries have by far the largest average shadow economies, between 35 and 44 percent, followed by the transition countries, between 20.7 percent and 34.9 percent, and finally the OECD countries with an average shadow economy of 15.1 percent using the electricity approach and 14.2 percent using the currency demand approach. But as already argued this comparison can only give some hints, since the methods, statistical approaches and specifications are quite different in the various studies.
Having extensively examined the size and rise of the shadow economy
in terms of value added over time, the analysis in this part focuses on
the shadow" labor market, as within the official labor market there is
a particularly tight relationship and "social network" between people who
are active in the shadow economy.) Moreover, by definition every
activity in the shadow economy involves a "shadow" labor market to some
extent: Hence, the "shadow labor market" includes all cases, where the
employees or the employers, or both, occupy a shadow economy position".
Why do people work in the shadow economy? In the official labor market,
the costs firms (and individuals) have to pay when "officially" hiring
someone are increased tremendously by the burden of tax and social contributions
on wages, as well as by the legal administrative regulation to control
economic activity.) In various OECD countries, these costs are
greater than the wage effectively earned by the worker providing a strong
incentive to work in the shadow economy. More detailed theoretical information
on the labor supply decision in the underground economy is given by Lemieux,
Fortin, and Fréchette (1994) who use micro data from a survey conducted
in Quebec City (Canada). In particular, their study provides some economic
insight into the size of the distortion caused by income taxation and the
welfare system. The results of this study suggest that hours worked in
the shadow economy are quite responsive to changes in the net wage in the
regular (official) sector. Their empirical results attribute this to a
(miss-)allocation of work from the official to the informal sector, where
it is not taxed. In this case, the substitution between labor-market activities
in the two sectors is quite high. These empirical findings clearly indicate,
that "participation rates and hours worked in the underground sector also
tend to be inversely related to the number of hours worked in the regular
sector" (Lemieux, Fortin, and Fréchette 1994 p. 235). These findings
demonstrate a large negative elasticity of hours worked in the shadow economy
with respect both to the wage rate in the regular sector as well as to
a high mobility between the sectors.
Illicit work can take many shapes. The underground use of labor may consist of a second job after (or even during) regular working hours. A second form is shadow economy work by individuals who do not participate in the official labor market. A third component is the employment of people (e.g. clandestine or illegal immigrants), who are not allowed to work in the official economy. Empirical research on the shadow economy labor market is even more difficult than of the shadow economy on the value added, since we have very little knowledge about how many hours an average "shadow economy worker" is actually working (from full time to a few hours, only); hence, it is not easy to provide empirical facts.)
The following results of portraying the shadow economy labor force are
based on the Worldbank database on informal employment in major cities
all over the world as well as on other sources (see footnote 11). The values
of the shadow economy labor force are calculated in absolute terms and
in percent of the official labor force under the assumption, that in rural
areas the shadow economy is at least as high as in the cities. This is
a conservative assumption, as in reality the shadow economy will most likely
be even larger in rural areas.) The estimation methods employed
are the survey technique and for some countries the MIMIC-method and the
method of the discrepancy between the official and actual labor force.
The following results are preliminary and should be treated as a first
attempt to calculate the shadow economy labor force.
As has already been stated, to calculate the shadow economy labor
force, the model approach, the method of the discrepancy between official
and actual labor force and the survey technique are used. The results are
comprised in tables 6 to 10. In table 6 the results of countries in Africa
are shown. Both the Republic of Congo and Gambia have the largest shadow
economy labour force with 80% of the official labor force, followed by
Guinee with 79%, Benin with 76,9% and Rwanda with 75%.) Zimbabwe
has the lowest value of a shadow economy labor force with 33,9% of the
official labor force. For African countries the figures show considerable
variation and should really be seen as first and preliminary results. On
average the shadow economy labor force in these 33 African countries is
54,2% (of the official labor force) and 24,6% of the population and Rwanda
with 38.7%. The three countries with the lowest shadow economy (in % of
official GNP) are Lesotho with 15.4%, Zimbabwe with 15.7% and Angola with
16.2%. The average size of the shadow economy in these 30 African countries
is 25.7% (of official GNP). If one makes the assumption that this informal
or shadow economy labor force is as productive as in the official economy
and contributes per capita a similar value added as if they work in the
official economy, the shadow economy GNP can be calculated from this shadow
economy labor force, which is also shown in table 6. To stress once again,
the following values have been calculated under the (extreme?) assumption,
that a fulltime shadow economy worker is as productive as his colleague
in the official economy. The largest shadow economy in percent of official
GNP has Gambia with 41,2%, followed by Guinee with 36,9% and Rwanda with
38,7%.
In table 7 some Asian countries are shown. Here, China, India and Indonesia are worth taking a closer look, as they are the three largest countries in Asia (from the point of view of population). In China, it is estimated that 160 million people work in the shadow economy - 21,9% of the official labor force.) In India 217 million people work in the shadow economy - 50% of the official labor force. In Indonesia 36,7 million people work in the shadow economy, that is 37,4% of the official labor force. In Pakistan 29,4 million people or 60% of the official labor force work in the shadow economy. One realizes that in Asia the shadow economy labor force is quite high, but also these values are preliminary and have to be reexamined again. On average the shadow economy labor force in these Asian countries forms 46,5% (of the official labor force) and 19,6% of the population. Sri Lanka and the Philippines have the lowest values of the shadow economy labor force with 31.3% and 30.6% of the official labor force. In terms of value added Nepal has with 37.6% (of official GNP) the greatest shadow economy followed by Yemen with 22.5% and India with 22.4%. The average size of the shadow economy in these 7 Asian countries is 19.5% (of official GNP).
In table 8 some Latin and South American states are shown. In absolute
terms, Brazil has the highest shadow economy labor force with 37,4 million
(49,2% of the official labor force), followed by Columbia with 9,7 million
or 53,8% of the official labor force. Also Ecuador with 58,8% and Peru
with 54,6% have a quite high shadow economy labor force (in percent of
the official labor force). Chile has the lowest shadow economy labor force
with 40%, as well as Paraguay with 41% and El Salvador with 47,3% of the
official labor force. On average the shadow economy labor force in these
9 countries is 49,6% (of the official labor force) and 20,3% of the population.
In terms of value added Ecuador has with 24.1% (of official GNP) the greatest
shadow economy followed by Columbia with 23.8% and El Salvador with 23.1%.
For the transition countries results from 9 economies were derived;
they are shown in table 9. Armenia has the highest values with a shadow
economy labor force of 75,5% of the official labor force, followed by Croatia
with 70% and Bulgaria with 63%. In absolute figures, Russia has by far
the biggest shadow economy labor force among the transition countries with
32,9 million "shadow economy workers", followed by Rumania with 4,7 million
and Kazakhstan with 2,8 million. Slovenia has the lowest shadow economy
labor force with 31% of the official labor force. On average the shadow
economy labor force in these 9 countries is 49% (of the official labor
force) and 23,9% of the population.
| Table
6: Africa: Shadow Economy Labor Force (Informal employment),
Population, official" Labour Force, and Shadow Economy GNP |
||||||||||
| Country |
|
|
|
|
|
|
||||
|
|
|
|
|
|
|
|
|
|
||
|
1
|
Angola |
|
|
|
|
|
|
|
|
|
|
2
|
Benin |
|
|
|
|
|
|
|
|
|
|
3
|
Botswana |
|
|
|
|
|
|
|
|
|
|
4
|
Burkina Faso |
|
|
|
|
|
|
|
|
|
|
5
|
Cameroun |
|
|
|
|
|
|
|
|
|
|
6
|
Chad |
|
|
|
|
|
|
|
|
|
|
7
|
Congo |
|
|
|
|
|
|
|
|
|
|
8
|
Cote d´Ivoire |
|
|
|
|
|
|
|
|
|
|
9
|
Dem. Rep. of Congo |
|
|
|
|
|
|
|
|
|
|
10
|
Ethiopia |
|
|
|
|
|
|
|
|
|
|
11
|
Gabon |
|
|
|
|
|
|
|
|
|
|
12
|
Gambia |
|
|
|
|
|
|
|
|
|
|
13
|
Ghana |
|
|
|
|
|
|
|
|
|
|
14
|
Guinee |
|
|
|
|
|
|
|
|
|
|
15
|
Kenya |
|
|
|
|
|
|
|
|
|
|
16
|
Lesotho |
|
|
|
|
|
|
|
|
|
|
17
|
Liberia |
|
|
|
|
|
|
|
|
|
|
18
|
Madagaskar |
|
|
|
|
|
|
|
|
|
|
19
|
Malawi |
|
|
|
|
|
|
|
|
|
|
20
|
Mali |
|
|
|
|
|
|
|
|
|
|
21
|
Mauritania |
|
|
|
|
|
|
|
|
|
|
22
|
Namibia |
|
|
|
|
|
|
|
|
|
|
23
|
Niger |
|
|
|
|
|
|
|
|
|
|
24
|
Nigeria |
|
|
|
|
|
|
|
|
|
|
25
|
Rwanda |
|
|
|
|
|
|
|
|
|
|
26
|
Senegal |
|
|
|
|
|
|
|
|
|
|
27
|
Sierra Leone |
|
|
|
|
|
|
|
|
|
|
28
|
Sudan |
|
|
|
|
|
|
|
|
|
|
29
|
Tanzania |
|
|
|
|
|
|
|
|
|
|
30
|
Togo |
|
|
|
|
|
|
|
|
|
|
31
|
Tunesia |
|
|
|
|
|
|
|
|
|
|
32
|
Uganda |
|
|
|
|
|
|
|
|
|
|
33
|
Zimbabwe |
|
|
|
|
|
|
|
|
|
| Average over 33 countries |
|
|
|
|
|
|||||
| Data Source: Own calculations based on World Bank, Africa Region Live Database, http://www.worldbank.org/html/extdr/regions.htm | ||||||||||
| Table 7: Asia - Shadow Economy Labor Force (Informal employment), Population, official" Labour Force, and Shadow Economy GNP | ||||||||||
| Country |
|
|
|
|
|
|
||||
|
|
|
|
|
|
|
|
|
|
||
|
1
|
China |
|
|
|
|
|
|
|
|
|
|
2
|
India |
|
|
|
|
|
|
|
|
|
|
3
|
Indonesia |
|
|
|
|
|
|
|
|
|
|
4
|
Mongolia |
|
|
|
|
|
|
|
|
|
|
5
|
Nepal |
|
|
|
|
|
|
|
|
|
|
6
|
Pakistan |
|
|
|
|
|
|
|
|
|
|
7
|
Philippines |
|
|
|
|
|
|
|
|
|
|
8
|
Sri Lanka |
|
|
|
|
|
|
|
|
|
|
9
|
Yemen |
|
|
|
|
|
|
|
|
|
| Average of 9 countries |
|
|
|
|
|
|||||
| Data Source: Own calculations based on World Bank, World Development Indicators, http://www.worldbank.org/html/extdr/regions.htm | ||||||||||
| Table 8: Latin America & Caribbean - Shadow Economy Labor Force (Informal employment), Population, official" Labour Force, and Shadow Economy GNP | ||||||||||
| Country |
|
|
|
|
|
|
||||
|
|
|
|
|
|
|
|
|
|
||
|
1
|
Bolivia |
|
|
|
|
|
|
|
|
|
|
2
|
Brazil |
|
|
|
|
|
|
|
|
|
|
3
|
Chile |
|
|
|
|
|
|
|
|
|
|
4
|
Columbia |
|
|
|
|
|
|
|
|
|
|
5
|
Ecuador |
|
|
|
|
|
|
|
|
|
|
6
|
El Salvador |
|
|
|
|
|
|
|
|
|
|
7
|
Guatemala |
|
|
|
|
|
|
|
|
|
|
8
|
Paraguay |
|
|
|
|
|
|
|
|
|
|
9
|
Peru |
|
|
|
|
|
|
|
|
|
| Average of 9 countries |
|
|
|
|
|
|||||
| Data Source: Own calculations based on World Bank, World Development Indicators, http://www.worldbank.org/html/extdr/regions.htm | ||||||||||
| Table 9: Transition Countries - Shadow Economy Labor Force (Informal employment), Population, official" Labour Force, and Shadow Economy GNP | ||||||||||
| Country |
|
|
|
|
|
|
||||
|
|
|
|
|
|
|
|
|
|
||
|
1
|
Armenia |
|
|
|
|
|
|
|
|
|
|
2
|
Bulgaria |
|
|
|
|
|
|
|
|
|
|
3
|
Croatia |
|
|
|
|
|
|
|
|
|
|
4
|
Georgia |
|
|
|
|
|
|
|
|
|
|
5
|
Kazakhstan |
|
|
|
|
|
|
|
|
|
|
6
|
Kyrgyzstan |
|
|
|
|
|
|
|
|
|
|
7
|
Romania |
|
|
|
|
|
|
|
|
|
|
8
|
Russian Federation |
|
|
|
|
|
|
|
|
|
|
9
|
Slovenia |
|
|
|
|
|
|
|
|
|
| Average of 9 countries |
|
|
|
|
|
|||||
| Data Source: Own calculations based on World Bank, World Development Indicators, http://www.worldbank.org/html/extdr/regions.htm | ||||||||||
| Countries | Year | Official GDP per capita in US-$1) | Shadow Economy GDP in US-$ per capita | Size of the Shadow Economy (in % of official GDP) Currency Demand Approach2) | Shadow Economy Labour Force in 1000 people3) | Shadow Economy Participants in % of official Labour Force4) | Sources of Shadow Economy Labour Force |
|
|
97-98 |
25,874 |
29,630 |
8.93 |
500-750 |
16.0 |
own calculations |
|
|
|
|
|
|
|
|
|
|
|
|
|
|
|
|
|
|
|
|
|
|
|
|
|
|
|
|
|
|
|
|
|
|
||
|
|
1997-98 |
24,363 |
34,379 |
14.9 |
1400-3200 |
6.0-12.0 |
own calculations |
|
|
1997-98 |
26,080 |
39,634 |
14.7 |
7000-9000 |
22.0 |
|
|
|
1997-98 |
20,361 |
29,425 |
27.3 |
6600-11400 |
30.0-48.0 |
own calculations |
|
|
1997-98 |
13,791 |
19,927 |
23.1 |
1500-4200 |
11.5-32.3 |
own calculations |
|
|
1997-98 |
25,685 |
37,331 |
19.8 |
1150 |
19.8 |
|
|
|
1997-98 |
22,179 |
32,226 |
19.6 |
20 000 |
11.9 |
|
|
|
1997-98 |
22,880 |
33,176 |
20.2 |
35 000 |
|
|
2) Source: Own calculations.
3) Estimated full-time jobs, including unregistered workers, illegal immigrants, and second jobs.
4) In percent of the population aged 20-69, survey method.
In almost all studies it has been found out, that the increase of
the tax and social security contribution burdens is one of the main causes
for the increase of the shadow economy. Since taxes affect labor-leisure
choices, and also stimulate labor supply in the shadow economy, or the
untaxed sector of the economy, the distortion of this choice is a major
concern of economists. The bigger the difference between the total cost
of labor in the official economy and the after-tax earnings (from work),
the greater is the incentive to avoid this difference and to work in the
shadow economy. Since this difference depends broadly on the social security
system and the overall tax burden, they are key features of the existence
and the increase of the shadow economy. But even major tax reforms with
major tax rate deductions will not lead to a substantial decrease of the
shadow economy. They will only be able to stabilize the size of the shadow
economy and avoid a further increase. Social networks and personal relationships,
the high profit from irregular activities and associated investments in
real and human capital are strong ties which prevent people from transferring
to the official economy. For Canada, Spiro (1993) expected similar reactions
of people facing an increase in indirect taxes (VAT, GST). After the introduction
of the GST in 1991 - in the midst of a recession - , the individuals, suffering
economic hardship because of the recession, turned to the shadow economy,
which led to a substantial loss in tax revenue. "Unfortunately, once this
habit is developed, it is unlikely that it will be abandoned merely because
economic growth resumes." (Spiro 1993 p. 255). They may not return to the
formal sector, even in the long run. This fact makes it even more difficult
for politicians to carry out major reforms because they may not gain a
lot from them.)
The most important factor in neoclassical models is the marginal tax rate. The higher the marginal tax rate, the greater is the substitution effect and the bigger the distortion of the labor-leisure decision. Especially when taking into account that the individual can also receive income in the shadow economy, the substitution effect is definitely larger than the income effect) and, hence, the individual works less in the official sector. The overall efficiency of the economy is, therefore (ceteris paribus), lower and the distortion leads to a welfare loss (according to official GNP and taxation.) But the welfare might also be viewed as increasing, if the welfare of those, who are working in the shadow economy, were taken into account, too.)
Empirical results of the influence of the tax burden on the shadow economy is provided in the studies of Schneider (1994b, 2000) and Johnson, Kaufmann and Zoido-Lobatón (1998a, 1998b); they all found strong evidence for the general influence of taxation on the shadow economy. This strong influence of indirect and direct taxation on the shadow economy will be further demonstrated by discussing empirical results in the case of Austria and the Scandinavian countries. For Austria the driving force for the shadow economy activities is the direct tax burden (including social security payments), it has the biggest influence, followed by the intensity of regulation and complexity of the tax system. A similar result has been achieved by Schneider (1986) for the Scandinavian countries (Denmark, Norway and Sweden). In all three countries various tax variables (average direct tax rate, average total tax rate (indirect and direct tax rate)) and marginal tax rates have the expected positive sign (on currency demand) and are highly statistically significant. Similar results are reached by Kirchgaessner (1983, 1984) for Germany and by Kloveland (1984) for Norway and Sweden.
Several other recent studies provide further evidence of the influence of income tax rates on the shadow economy: Cebula (1997), using Feige data for the shadow economy, found evidence of the impact of government income tax rates, IRS audit probabilities, and IRS penalty policies on the relative size of the shadow economy in the United States. Cebula concludes that a restraint of any further increase of the top marginal income tax rate may at least not lead to a further increase of the shadow economy, while increased IRS audits and penalties might reduce the size of the shadow economy. His findings indicate that there is generally a strong influence of state activities on the size of the shadow economy: For example, if the marginal federal personal income tax rate increases by one percentage point, ceteris paribus, the shadow economy rises by 1.4 percentage points. In another investigation, Hill and Kabir (1996) found empirical evidence that marginal tax rates are more relevant than average tax rates, and that a substitution of direct taxes by indirect taxes seems unlikely to improve tax compliance. Further evidence on the effect of taxation on the shadow economy is presented by Johnson, Kaufmann, and Zoido-Lobatón (1998b), who come to the conclusion that it is not higher tax rates per se that increase the size of the shadow economy, but the ineffective and discretionary application of the tax system and the regulations by governments. Their finding, that there is a negative correlation) between the size of the unofficial economy and the top (marginal) tax rates, might be unexpected. But since other factors like tax deductibility, tax relives, tax exemptions, the choice between different tax systems, and various other options for legal tax avoidance were not taken into account, it is not all that surprising.) On the other side Johnson, Kaufmann and Zoido-Lobatón (1998b) find a positive correlation between the size of the shadow economy and the corporate tax burden. They come to the overall conclusion that there is a large difference between the impact of either direct taxes or the corporate tax burden. Institutional aspects, like the efficiency of the administration, the extent of control rights held by politicians and bureaucrats, and the amount of bribery and especially corruption, therefore, play a major role in this "bargaining game" between the government and the taxpayers.
The increase of the intensity of regulations (often measured in
the numbers of laws and regulations, like licenses requirements) is another
important factor, which reduces the freedom (of choice) for individuals
engaged in the official economy.) One can think of labor market
regulations, trade barriers, and labor restrictions for foreigners. Johnson,
Kaufmann, and Zoido-Lobatón (1998b) find an overall significant
empirical evidence of the influence of (labor) regulations on the shadow
economy, the impact is clearly described and theoretically derived in other
studies, e.g. for Germany (Deregulation Commission 1990/91). Regulations
lead to a substantial increase in labor costs in the official economy.
But since most of these costs can be shifted on the employees, these costs
provide another incentive to work in the shadow economy, where they can
be avoided. Empirical evidence supporting the model of Johnson, Kaufmann,
and Shleifer (1997), which predicts, inter alia, that countries with more
general regulation of their economies tend to have a higher share of the
unofficial economy in total GDP, is found in their empirical analysis.
A one-point increase of the regulation index (ranging from 1 to 5, with
5 = the most regulation in a country), ceteris paribus, is associated with
an 8.1 percentage point increase in the share of the shadow economy, when
controlled for GDP per capita (Johnson et. al. (1998b), p. 18). They conclude
that it is the enforcement of regulation, which is the key factor for the
burden levied on firms and individuals, and not the overall extent of regulation
- mostly not enforced - which drive firms into the shadow economy. Friedman,
Johnson, Kaufmann and Zoido-Lobaton (1999) reach a similar result. In their
study every available measure of regulation is significantly correlated
with the share of the unofficial economy and the sign of the relationship
is unambiguous: more regulation is correlated with a larger shadow economy.
A one point increase in an index of regulation (ranging from 1-5) is associated
with a 10 % increase in the shadow economy for 76 developing, transition
and developed countries.
These findings demonstrate that governments should put more emphasis
on improving enforcement of laws and regulations, rather than increasing
their number. Some governments, however, prefer this policy option (more
regulations and laws), when trying to reduce the shadow economy, mostly
because it leads to an increase in power of the bureaucrats and to a higher
rate of employment in the public sector.
An increase of the shadow economy leads to reduced state revenues
which in turn reduces the quality and quantity of publicly provided goods
and services. Ultimately, this can lead to an increase in the tax rates
for firms and individuals in the official sector, quite often combined
with a deterioration in the quality of the public goods (such as the public
infrastructure) and of the administration, with the consequence of even
stronger incentives to participate in the shadow economy. Johnson, Kaufmann,
and Zoido-Lobatón (1998b) present a simple model of this relationship.
Their findings show that smaller shadow economies appear in countries with
higher tax revenues, if achieved by lower tax rates, fewer laws and regulations
and less bribery facing enterprises. Countries with a better rule of the
law, which is financed by tax revenues, also have smaller shadow economies.
Transition countries have higher levels of regulation leading to a significantly
higher incidence of bribery, higher effective taxes on official activities
and a large discretionary framework of regulations and consequently to
a higher shadow economy. The overall conclusion is that "wealthier countries
of the OECD, as well as some in Eastern Europe find themselves in the good
equilibrium of relatively low tax and regulatory burden, sizeable revenue
mobilization, good rule of law and corruption control, and [relatively]
small unofficial economy. By contrast, a number of countries in Latin American
and the Former Soviet Union exhibit characteristics consistent with a bad
equilibrium: tax and regulatory discretion and burden on the firm is high,
the rule of law is weak, and there is a high incidence of bribery and a
relatively high share of activities in the unofficial economy." (Johnson,
Kaufmann and Zoido-Lobatón 1998a p. I).
As has already been mentioned in chapter 2 to undertake attempts
to measure the size of a shadow economy is a difficult and challenging
task. In this chapter a comprehensive overview is given about the current
knowledge of the various procedures to estimate the shadow economy. To
measure the size and development of the shadow economy three different
types of methods are most widely used. They are briefly discussed in the
following three subsections.
These are micro approaches which employ either well designed surveys
and samples based on voluntary replies or tax auditing and other compliance
methods. Sample surveys designed for estimation of the shadow economy are
widely used in a number of countries) to measure the shadow
economy. The main disadvantage of this method is that it presents the flaws
of all surveys: average precision and results depend greatly on the respondents
willingness to cooperate. It is difficult to asses the rise of the undeclared
work from a direct questionnaire. Most interviewed hesitate to confess
a fraudulent behavior and quite often responses are rarely reliable so
that it is difficult, from this type of answers, to calculate a real estimate
in monetary terms of the extend of undeclared work. The main advantage
of this method lies in the detailed information about the structure of
the shadow economy, but the results from these kinds of surveys are very
sensitive to the way the questionnaire is formulated).
Estimates of the shadow economy can also be based on the discrepancy between income declared for tax purposes and that measured by selective checks. Fiscal auditing programs have been particularly effective in this regard. Designed to measure the amount of undeclared taxable income, they have been used to calculate the shadow economy in several countries.) A number of difficulties beset this approach. Firstly, using tax compliance data is equivalent to using a (possibly biased) sample of the population. However, since in general a selection of tax payers for tax audit is not random, but based on properties of submitted (tax) returns which indicate a certain likelihood of (tax) fraud, such a sample is not a random one of the whole population. This factor is likely to bias compliance based estimates of the black economy. Secondly, estimates based on tax audits reflect that portion of black economy income which the authorities succeeded in discovering and this is likely to be only a fraction of hidden income.
A further disadvantage of the two direct methods (surveys and tax auditing)
is that they lead only to point estimates. Moreover, it is unlikely that
they capture all shadow" activities, so they can be seen as providing
lower bound estimates. They are unable (at least at present) to provide
estimates of the development and growth of the shadow economy over a longer
period of time. As already argued, they have, however at least one considerable
advantage - they can provide detailed information about shadow economy
activities and the structure and composition of those who work in the shadow
economy.
These approaches, which are also called indicator" approaches,
are mostly macroeconomic ones and use various economic and other indicators
that contain information about the development of the shadow economy (over
time). Currently there are five indicators which leave some traces" of
the development of the shadow economy:
This approach is based on discrepancies between income and expenditure
statistics. In national accounting the income measure of GNP should be
equal to the expenditure measure of GNP. Thus, if an independent estimate
of the expenditure site of the national accounts is available, the gap
between the expenditure measure and the income measure can be used as an
indicator of the extend of the black economy.) However, since
national accounts statisticians will be anxious to minimize this discrepancy,
the initial discrepancy or first estimate, rather than the published discrepancy
should be employed for this purpose. If all the components of the expenditure
site where measured without error, then this approach would indeed yield
a good estimate of the scale of the shadow economy. However, unfortunately,
this is not the case and the discrepancy, therefore, reflects all omissions
and errors everywhere in the national accounts statistics as well as the
shadow economy activity. These estimates may therefore be very crude and
of questionable reliability.)
The Discrepancy between the Official and Actual Labor Force
A decline in participation of the labor force in the official economy
can be seen as an indication of increased activity in the shadow economy.
If total labor force participation is assumed to be constant, a decreasing
official rate of participation can be seen as an indicator of an increase
in the activities in the shadow economy, ceteris paribus.) The
weakness of this method is that differences in the rate of participation
may also have other causes. Moreover, people can work in the shadow economy
and have a job in the official economy. Therefore such estimates may
be viewed as weak indicators of the size and development of the shadow
economy.
This approach has been developed by Feige. It assumes, that there
is a constant relation over time between the volume of transaction and
official GNP. Feiges approach therefore starts from Fishers quantity
equation, M*V = p*T (with M = money, V = velocity, p = prices, and T =
total transactions). Assumptions have to be made about the velocity of
money and about the relationships between the value of total transactions
(p*T) and total (=official + unofficial) nominal GNP. Relating total nominal
GNP to total transactions, the GNP of the shadow economy can be calculated
by subtracting the official GNP from total nominal GNP. However, to derive
figures for the shadow economy, Feige has to assume a base year in which
there is no shadow economy, and therefore the ratio of p*T to total nominal
(official = total) GNP was normal" and would have been constant over time,
if there had been no shadow economy. This method, too, has several weaknesses:
for instance, the assumption of a base year with no shadow economy, and
the assumption of a normal" ratio of transactions constant over time.
Moreover, to obtain reliable shadow economy estimates, precise figures
of the total volume of transactions should be available. This availability
might be especially difficult to achieve for cash transactions, because
they depend, among other factors, on the durability of bank notes, in terms
of the quality of the papers on which they are printed.) Also,
in this approach the assumption is made that all variations in the ratio
between the total value of transaction and the officially measured GNP
are due to the shadow economy. This means that a considerable amount of
data is required in order to eliminate financial transactions from "pure"
cross payments, which are totally legal and have nothing to do with the
shadow economy. In general, although this approach is theoretically attractive,
the empirical requirements necessary to obtain reliable estimates are so
difficult to fulfil, that its application may lead to doubtful results.
Cagans approach was further developed by Tanzi (1980, 1983), who econometrically
estimated a currency demand function for the United States for the period
1929 to 1980 in order to calculate the shadow economy. His approach assumes
that shadow (or hidden) transactions are undertaken in the form of cash
payments, so as to leave no observable traces for the authorities. An increase
in the size of the shadow economy will therefore increase the demand for
currency. To isolate the resulting excess" demand for currency, an equation
for currency demand is econometrically estimated over time. All conventional
possible factors, such as the development of income, payment habits, interest
rates, and so on, are controlled for. Additionally, such variables as the
direct and indirect tax burden, government regulation and the complexity
of the tax system, which are assumed to be the major factors causing people
to work in the shadow economy, are included in the estimation equation.
The basic regression equation for the currency demand, proposed by Tanzi
(1983), is the following:
ln (C / M2)t = b O + b 1 ln (1 + TW)t + b 2 ln (WS / Y)t + b 3 ln Rt + b 4 ln (Y / N)t + ut
with b 1 > 0, b 2 > 0, b 3 < 0, b 4 > 0
where
ln denotes natural logarithms,
C / M2 is the ratio of cash holdings to current and deposit accounts,
TW is a weighted average tax rate (to proxy changes in the size of the shadow economy),
WS / Y is a proportion of wages and salaries in national income (to capture changing payment and money holding patterns),
R is the interest paid on savings deposits (to capture the opportunity cost of holding cash) and
Y / N is the per capita income.)
The excess" increase in currency, which is the amount unexplained by the conventional or normal factors (mentioned above) is then attributed to the rising tax burden and the other reasons leading people to work in the shadow economy. Figures for the size and development of the shadow economy can be calculated in a first step by comparing the difference between the development of currency when the direct and indirect tax burden (and government regulations) are held at its lowest value, and the development of currency with the current (much higher) burden of taxation and government regulations. Assuming in a second step the same income velocity for currency used in the shadow economy as for legal M1 in the official economy, the size of the shadow can be computed and compared to the official GDP.
The currency demand approach is one of the most commonly used approaches. It has been applied to many OECD countries,) but has nevertheless been criticized on various grounds.) The most commonly raised objections to this method are:
To measure overall (official and unofficial) economic activity in an economy, Kaufmann and Kaliberda (1996) assume that electric-power consumption is regarded as the single best physical indicator of overall economic activity. Overall (official and unofficial) economic activity and electricity consumption have been empirically observed throughout the world to move in lockstep with an electricity/GDP elasticity usually close to one. By having a proxy measurement for the overall economy and subtracting it from estimates of official GDP, Kaufmann and Kaliberda derive an estimate of unofficial GDP. This means, that Kaufmann and Kaliberda suggest, that the growth of total electricity consumption is an indicator for representing a growth of official and unofficial GDP. According to this approach, the difference between the gross rate of registered (official) GDP and the cross rate of total electricity consumption can be attributed to the growth of the shadow economy. This method is very simple and appealing, however, it can also be criticized on various grounds:
Lackó (1996, 1998, 1999) assumes that a certain part of the shadow economy is associated with the household consumption of electricity. It comprises, among others, the so-called household production, do-it-yourself activities, and other non registered production and services. Lackó assumes that in countries where the section of the shadow economy associated with the household electricity consumption is high, the rest of the hidden economy, that is the part Lackó cannot measure, will also be high. Lackó (1996, pp.19 ff.) assumes that in each country a part of the household consumption of electricity is used in the shadow economy.
Lackós approach (1998, p.133) can be described by the following two equations:
ln Ei = a 1 ln Ci + a 2 ln PRi + a 3 Gi + a 4 Qi + a 5 Hi + ui (1)
with a 1 > 0, a 2 < 0, a 3 > 0, a 4 < 0, a 5 > 0
Hi = b 1 Ti + b 2 (Si Ti) + b 3 Di (2)
with b 1 > 0, b 2 < 0, b 3 > 0
where
i: the number assigned to the country,
Ei: per capita household electricity consumption in country i in Mtoe,
PRi: the real price of consumption of 1 kWh of residential electricity in US dollars (at purchasing power parity),
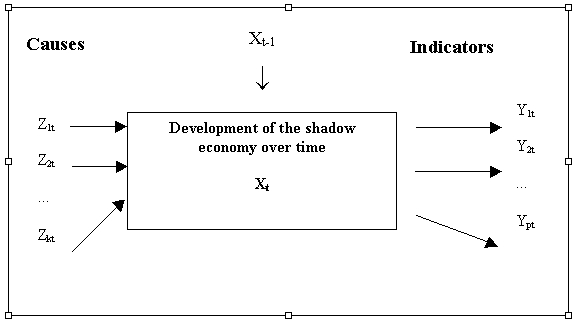
Figure 1: Development of the shadow economy over time.
There is a large body of literature on the possible causes and indicators of the shadow economy, in which the following three types of causes are distinguished:Causes
IndicatorsThe burden of direct and indirect taxation, both actual and perceived: a rising burden of taxation provides a strong incentive to work in the shadow economy. The burden of regulation as proxy for all other state activities: it is assumed that increases in the burden of regulation give a strong incentive to enter the shadow economy. The tax morality" (citizens attitudes toward the state), which describes the readiness of individuals (at least partly) to leave their official occupations and enter the shadow economy: it is assumed that a declining tax morality tends to increase the size of the shadow economy.) A change in the size of the shadow economy may be reflected in the following indicators:
The latest use of the model approach has been undertaken by Giles (1999a, 1999b) and by Giles, Linsey and Gupsa (1999). They basically estimates a comprehensive (dynamic) MIMIC model to get a time serious index of the hidden/measured output of New Zealand or Canada, and then estimate a separate "cash-demand model" to obtain a benchmark for converting this index into percentage units. Unlike earlier empirical studies of the hidden economy, they paid proper attention to the non-stationary, and possible co-integration of time serious data in both models. Again this MIMIC model treats hidden output as a latent variable, and uses several (measurable) causal variables and indicator variables. The former include measures of the average and marginal tax rates, inflation, real income and the degree of regulation in the economy. The latter include changes in the (male) labor force participation rate and in the cash/money supply ratio. In their cash-demand equation they allow for different velocities of currency circulation in the hidden and recorded economies. Their cash-demand equation is not used as an input to determine the variation in the hidden economy over time it is used only to obtain the long-run average value of hidden/measured output, so that the index for this ratio predicted by the MIMIC model can be used to calculate a level and the percentage units of the shadow economy. Giles latest combination of the currency demand and MIMIC approach clearly shows that some progress in the estimation technique of the shadow economy has been achieved and a number of critical points have been overcome.Development of monetary indicators: if activities in the shadow economy rise, additional monetary transactions are required. Development of the labor market: increasing participation of workers in the hidden sector results in a decrease in participation in the official economy. Similarly, increased activities in the hidden sector may be expected to be reflected in shorter working hours in the official economy. Development of the production market: an increase in the shadow economy means that inputs (especially labor) move out of the official economy (at least partly); this displacement might have a depressing effect on the official growth rate of the economy.
Summary and Conclusions
There are many obstacles to be overcome to measure the size of the shadow economy (in value added and in the labor force) and to analyze its consequences on the official economy, although some progress has been made. In this paper has been shown that though it is difficult to estimate the size of the shadow economy (in value added and in the labor force), it is not impossible. I have demonstrated that with various methods, e.g. the currency demand, the physical input measure the discrepancy method and the model approach, some insights can be provided into the size and development of the shadow economy (labor force) of the developing, transition and the OECD countries. The general impression from the results of these methods is that for all countries investigated the shadow economy (labor force) has reached a remarkably large size. The results are shown in table 11.To summarize: As it has already been argued, there is no best" or commonly accepted method; each approach has its specific strengths and weaknesses as well as specific insights and results. Although the different methods provide a rather wide range of estimates, there is a common finding that the size of the shadow economies for most transition and all investigated OECD countries has been growing over the recent decade. A similar finding can be made for the shadow labor market" which is attracting a growing attention due to high unemployment in European OECD countries. Furthermore, the results of this study show that an increasing burden of taxation and social security payments, combined with rising state regulatory activities, are the major driving forces for the size and growth of the shadow economy. Finally, to conclude: Shadow economies are a complex phenomenon, present to an important extent even in the industrialized and developed economies. People engage in shadow economic activity for a variety of reasons, among most important, of which we can count are government actions, most notable taxation and regulation. With these two insights, goes a third, no less important one: a government aiming to decrease shadow economic activity has to first and foremost analyze the complex and frequently contradictory relationships among consequences of its own policy decisions.
Table 11: Average Size of the Shadow Economy for Developing, Transition and OECD-Countries in Terms of Value-Added and of the Labor Force over two periods (1989/93 and 1997/98)
Countries
Average Size of the Shadow Economy Value added in % of official GDP 1989/93
Average Size of the Shadow Economy Labor Force in % of official Labor Force 1997/98 Average Size of Shadow Economy value added in % of official GNP 1997/98 Physical Input Method (Number of Countries) Currency Demand method (Number of Countries) Survey and Discrepancy Methods (Number of Countries)
Calculated from Shadow Economy Labor Force (Number of Countries)
Developing countries: Africa 43.9 9.41) (7) (1)
- 54.2 (33)
25.7 (28)
Central and South America 38.9 (15)
- 49.6 (9)
20.3 (8)
Asia 35.0 (11)
- 46.5 (9)
19.5 (7)
Transition countries: Former Soviet Union 25.7 34.9 2) (12) (12)
-
49.0 3)
(9)
24.1 3)
(9)
Central and Eastern Europe 20.7 32.4 2) (9) (9)
- OECD Countries 15.1 (21)
14.2 (21)
17.3 (7)
16.8 4) (21)
1) Value of South Africa.2) Using the values from Lackó (1999) over 1990-93.
3) Average Size of "Former Soviet Union" and of Central and Eastern European Countries.
4) Own calculations using the Currency Demand Method and the Dymimic Approach.
Source: Own calculations using table 2 10.
References
Andreoni, James; Erard, Brian, and Jonathan Feinstein (1998): Tax compliance. Journal of Economic Literature, 36, pp. 818-860.
Bagachwa, M.S.D. and A. Naho (1995): Estimating the second economy in Tanzania, World Development, 23, no. 8, pp. 1387-1399.
Bartlett, Bruce (1998): Corruption, the underground economy, and taxation. Washington D.C.: National Center for Policy Analysis, unpublished manuscript.
Bhattacharyya, D.K. (1999): On the Economic Rationale of Estimating the Hidden Economy, The Economic Journal 109/456, pp. 348-359.
Blades, Derek (1982): "The Hidden Economy and the National Accounts", OECD (Occasional Studies), Paris, pp. 28-44.
Boeschoten, Werner C. and Marcel M.G. Fase (1984): The volume of payments and the informal economy in the Netherlands 1965-1982, M. Nijhoff, Dordrecht.
Brehm, J.W. (1966): A theory of psychological reactance. New York (Academic Press).
Brehm, J.W. (1972): Responses to loss of freedom. A theory of psychological reactance. Morristown (General Learning Press).
Cagan, Phillip (1958): "The Demand for Currency Relative to the Total Money Supply," Journal of Political Economy, 66:3, pp. 302-328.
Cappiello, M.A: (1986): "Proposita di bibliografia ragionata sulleconomia sommersa nellindustria (Italia 1970-82)", pp. 307-345, in: Bagnasco, A. (ed.): Laltra metà delleconomia. La ricerca internazionale sulleconomia informale, Liguori, Naples.
Cebula, Richard J. (1997): "An Empirical Analysis of the Impact of Government Tax and Auditing Policies on the Size of the Underground Economy: The Case of the United States, 1993-94:" American Journal of Economics and Sociology, 56:2, pp.173-185.
Chickering, Lawrence A. and Muhamed Salahdine (eds.) (1991): The silent revolution-The informal sector in five Asian and near Eastern countries, San Francisco: An International Center for Economic Growth Publication (ICS Press).
Clotefelter, Charles T. (1983): Tax evasion and tax rates: An analysis of individual return, Review of Economic Statistics, 65/3, pp. 363-373.
Contini, Bruno (1981): Labor market segmentation and the development of the parallel economy the Italian experience, Oxford Economic Papers, 33/4, pp. 401-12.
Dallago, Bruno (1990): The irregular economy: The "underground economy" and the "black labor market", Dartmouth (U.K.), Publishing Company.
Del Boca, Daniela. (1981): Parallel economy and allocation of time, Micros (Quarterly Journal of Microeconomics), 4/2, pp. 13-18.
Del Boca, Daniela and Francesco Forte (1982): Recent empirical surveys and theoretical interpretations of the parallel economy in Italy; Tanzi, Vito (1982) (ed.): The underground economy in the United States and abroad, Lexington (Mass.), Lexington, pp. 160-178.
Feige, Edgar L. (1986): A re-examination of the "Underground Economy" in the United States. IMF Staff Papers, 33/ 4, pp. 768-781.
Feige, Edgar L. (1989) (ed.): The underground economies. Tax evasion and information distortion. Cambridge, New York, Melbourne, Cambridge University Press.
Feige, Edgar L. (1994): The underground economy and the currency enigma, Supplement to Public Finance/ Finances Publiques, 49, pp. 119-136.
Feige, Edgar L. (1996): Overseas holdings of U.S. currency and the underground economy, in: Pozo, Susan (ed.): Exploring the Underground Economy. Kalamazoo, Michigan, pp. 5-62.
Franz, A. (1983): Wie groß ist die "schwarze" Wirtschaft?, Mitteilungsblatt der Österreichischen Statistischen Gesellschaft, 49/1, pp. 1-6.
Frey, Bruno S. and Hannelore Weck (1983a): "Bureaucracy and the Shadow Economy: A Macro-Approach", in Horst Hanusch (ed.): Anatomy of Government Deficiencies. Berlin: Springer, pp. 89-109.
Frey, Bruno S. and Hannelore Weck (1983b): "Estimating the Shadow Economy: A Naive Approach," Oxford Economic Papers, 35, pp. 23-44.
Frey, Bruno S. and Hannelore Weck-Hannemann (1984): The hidden economy as an "unobserved" variable, European Economic Review, 26/1, pp. 33-53.
Frey, Bruno S. and Werner Pommerehne (1984): The hidden economy: State and prospect for measurement, Review of Income and Wealth, 30/1, pp. 1-23.
Frey, Bruno S., Weck Hannelore and Werner W. Pommerehne (1982): Has the shadow economy grown in Germany? An exploratory study, Weltwirtschaftliches Archiv, 118/4, pp. 499-524.
Frey, L. (1972): Il lavoro a domicilio in Lombardia, Giunta Regionale Lombarda, Assessorato al Lavoro, Milan.
Frey, L. (1978): "Il lavoro nero nel 1977 in Italia", Tendenze della occupazione, no. 6.
Friedman, E., Johnson, S., Kaufmann, D. and Zoido-Labton, P. (1999): Dodging the grabbing hand: The determinants of unofficial activity in 69 countries, Discussion paper, Washington D.C: World Bank.
Giles, David, E.A. (1999a): Measuring the hidden economy: Implications for econometric modelling, The Economic Journal, 109/456, pp.370-380.
Giles, David, E.A. (1999b): Modelling the hidden economy in the tax-gap in New Zealand, Working paper, Department of Economics, University of Victoria, Canada.
Giles, David, E.A., Tedds, Linsey, M. and Werkneh, Gugsa (1999): The Canadian underground and measured economies, Working paper, Department of Economics, University of Victoria, Canada.
Gutmann, Pierre M. (1977): "The Subterranean Economy," Financial Analysts Journal, 34:1, pp. 24-27.
Hartzenburg, G.M. and Leimann, A.: The Informal Economy and its Growth Potential, In: Adebian, E. and Standish, B. (eds.) Economic Growth in South Africa, Oxford: Oxford University Press, 1992, pp. 187-214.
Hill, Roderick and Muhammed Kabir (1996): Tax rates, the tax mix, and the growth of the underground economy in Canada: What can we infer? Canadian Tax Journal/ Revue Fiscale Canadienne, 44/ 6, pp. 1552-1583.
IRS (1979): Estimates of income unreported on individual tax reforms, Washington D.C.: Internal revenue service, U.S. Department of the Treasury.
IRS (1983): Income tax compliance research: Estimates for 1973-81, Washington D.C.: Internal revenue service, U.S. Department of the Treasury.
Isachsen, Arne J. and Steinar Strom (1985): The size and growth of the hidden economy in Norway, Review of Income and Wealth, 31/1, pp. 21-38.
Isachsen, Arne J.; Klovland, Jan and Steinar Strom (1982): The hidden economy in Norway, in: Tanzi Vito (ed.): The underground economy in the United States and Abroad, Heath, Lexington, pp. 209-231.
Johnson, Simon; Kaufmann, Daniel; and Andrei Shleifer (1997): The unofficial economy in transition, Brookings Papers on Economic Activity, Fall, Washington D.C.
Johnson, Simon; Kaufmann, Daniel and Pablo Zoido-Lobatón (1998a): Regulatory discretion and the unofficial economy. The American Economic Review, 88/ 2, pp. 387-392.
Johnson, Simon; Kaufmann, Daniel and Pablo Zoido-Lobatón (1998b): Corruption, public finances and the unofficial economy. Washington, D.C.: The World Bank, discussion paper.
Kaufmann, Daniel and Kaliberda, Aleksander (1996), Integrating the unofficial economy into the dynamics of post socialist economies: A framework of analyses and evidence, Washington, D.C., The Worldbank, Policy research working paper 1691.
Kirchgaessner, Gebhard (1983): Size and development of the West German shadow economy, 1955-1980, Zeitschrift für die gesamte Staatswissenschaft, 139/2, pp. 197-214.
Kirchgaessner, Gebhard (1984): Verfahren zur Erfassung des in der Schattenwirtschaft erarbeiteten Sozialprodukts, Allgemeines Statistisches Archiv, 68/4, pp. 378-405.
Klovland, Jan (1984): "Tax Evasion and the Demand for Currency in Norway and Sweden: Is there a Hidden Relationship?" Scandinavian Journal of Economics, 86:4, pp. 423-39.
Lackó Mária (1996): Hidden economy in East-European countries in international comparison, Laxenburg: International Institute for Applied Systems Analysis (IIASA), working paper.
Lackó Mária (1998): The hidden economies of Visegrad countries in international comparison: A household electricity approach, In: Halpern, L. and Wyplosz, Ch. (eds.), Hungary: Two wards a market economy, Cambridge (Mass.): Cambridge University Press, p.128-152.
Lackó Mária (1999): Hidden economy an unknown quantitiy? Comparative analyses of hidden economies in transition countries in 1989-95, Working paper 9905, Department of Economics, University of Linz, Austria.
Langfeldt, Enno (1984): The unobserved economy in the Federal Republic of Germany, in: Feige, Edgar L. (ed.): The unobserved economy, Cambridge University Press., pp. 236-260.
Lemieux, Thomas; Fortin, Bernard; and Pierre Fréchette (1994):The effect of taxes on labor supply in the underground economy. The American Economic Review, 84/No. 1, pp. 231-254.
Lippert, Owen and Michael Walker (eds.) (1997): The underground economy: Global evidences of its size and impact, Vancouver, B.C.: The Frazer Institute.
Lizzeri, C. (1979): Mezzogiorno in controluce. Enel, Naples.
Loayza, Norman V. (1996): The economics of the informal sector: a simple model and some empirical evidence from Latin America. Carnegie-Rochester Conference Series on Public Policy 45, pp. 129-162.
Lubell, Herald (1991): The informal sector in the 1980s and 1990s, Paris: OECD.
MacAfee, Kerrick (1980): A Glimpse of the hidden economy in the national accounts, Economic Trends, 136, pp. 81-87.
Madzarevic, Sanja and Davor Mikulic (1997): Measuring the unofficial economy by the system of national accounts, Zagreb: Institute of Public Finance, working paper.
Mauleon, Ignacio (1998): Quantitative Estimation of the Spanish Underground Economy, Discussion paper, Department of Economics and History, University of Salamanka, Salamanka, Spain.
Mogensen, Gunnar V.; Kvist, Hans K.; Körmendi, Eszter and Soren Pedersen (1995): The shadow economy in Denmark 1994: Measurement and results, Study no. 3, Copenhagen: The Rockwool Foundation Research Unit.
Morris, B. (1993), Editorial Statement. International Economic Insides, IV, International Statistical Yearbook, Budapest.
OHiggins, Michael (1989): Assessing the underground economy in the United Kingdom, in: Feige, E.L. (ed.): The underground economies: tax evasion and information distortion, Cambridge: Cambridge University Press, pp. 175-195.
ONeill, David M. (1983): Growth of the underground economy 1950-81: Some evidence from the current population survey, Study for the Joint Economic Committee, U.S. Congress, Joint Committee Print 98-122, U.S. Gov. Printing Office, Washington.
Park, T. (1979): Reconciliation between personal income and taxable income, pp. 1947-77, mimeo, Washington D.C.: Bureau of Economic Analysis.
Pelzmann, Linde (1988): Wirtschaftspsychologie. Arbeitslosenforschung, Schattenwirtschaft, Steuerpsychologie. Wien, New York (Springer).
Petersen, Hans-Georg (1982): Size of the public sector, economic growth and the informal economy: Development trends in the Federal Republic of Germany, Review of Income and Wealth, 28/2, pp. 191-215.
Pissarides, C. and Weber, G. (1988): An expenditure based estimate of Britains black economy, CLE working paper no. 104, London.
Pommerehne, Werner W. and Friedrich Schneider (1985): The decline of productivity growth and the rise of the shadow economy in the U.S., Working Paper 85-9, University of Aarhus, Aarhus, Denmark.
Portes, Alejandro (1996): The informal economy, in: Pozo, Susan (ed.): Exploring the underground economy. Kalamazoo, Michigan, pp. 147-165.
Pozo, Susan (ed.) (1996): Exploring the underground economy: Studies of illegal and unreported activity, Michigan: W.E. Upjohn, Institute for Employment Research.
Rogoff, Kenneth, (1998), Blessing or Curse? Foreign and underground demand for euro notes, Economic policy: The European Forum 26, pp. 261-304.
Schneider, Friedrich (1986): Estimating the size of the Danish shadow economy using the currency demand approach: An attempt, The Scandinavian Journal of Economics, 88/4, pp. 643-668.
Schneider, Friedrich (1994a): Measuring the size and development of the shadow economy. Can the causes be found and the obstacles be overcome? in: Brandstaetter, Hermann, and Güth, Werner (eds.): Essays on Economic Psychology, Berlin, Heidelberg, Springer Publishing Company, pp. 193-212.
Schneider, Friedrich (1994b): Can the shadow economy be reduced through major tax reforms? An empirical investigation for Austria, Supplement to Public Finance/ Finances Publiques, 49, pp. 137-152.
Schneider, Friedrich (1997): The shadow economies of Western Europe, Journal of the Institute of Economic Affairs, 17/3, pp. 42-48.
Schneider, Friedrich (1998b): Stellt das Anwachsen der Schwarzarbeit eine wirtschaftspolitische Herausforderung dar? Einige Gedanken aus volkswirtschaftlicher Sicht. Linz, Mitteilungen des Instituts für angewandte Wirtschaftsforschung (IAW), I/98, S. 4-13.
Schneider, Friedrich (2000), The Increase of the Size of the Shadow Economy of 18 OECD-Countries: Some Preliminary Explanations, Paper presented at the Annual Public Choice Meeting, March 10-12, 2000, Charleston, S.C.
Schneider, Friedrich and Dominik Enste (2000): Shadow Economies: Size, Causes, and Consequences, The Journal of Economic Literature, 38/1, pp. 77-114.
Smith, J.D (1985): Market motives in the informal economy, in: Gaertner, W. and Wenig, A. (eds.): The economics of the shadow economy, Heidelberg: Springer Publishing Company, pp. 161-177.
Spiro, Peter S. (1993): "Evidence of a Post-GST Increase in the Underground Economy;" Canadian Tax Journal/ Revue Fiscale Canadienne, , 41:2, pp. 247-258.
Tanzi, Vito (1982) (ed.): The underground economy in the United States and abroad, Lexington (Mass.), Lexington.
Tanzi, Vito (1982): A second (and more skeptical) look at the underground economy in the United States; in: Tanzi, Vito (1982) (ed.): The underground economy in the United States and abroad, Lexington (Mass.), Lexington, pp. 38-56.
Tanzi, Vito (1986): The underground economy in the United States, Reply to comments by Feige, Thomas, and Zilberfarb. IMF - Staff Papers, 33/ 4, pp. 799-811.
Thomas, Jim J. (1986): The underground economy in the United States: A comment on Tanzi, IMF-Staff Papers, Vol. 33, No. 4, pp. 782-789.
Thomas, Jim J. (1992): Informal economic activity, LSE, Handbooks in Economics, London: Harvester Wheatsheaf.
Thomas, Jim J. (1999): Quantifying the Black Economy: Measurement without Theory Yet Again?, The Economic Journal 109/456, pp. 381-389.
Witte, A.D. (1987): The nature and extend of unreported activity: A survey concentrating on a recent US-research, in: Alessandrini, S. and Dallago, B. (eds.): The unofficial economy: Consequences and perspectives in different economic systems, Gower: Aldershot.
Yoo, Tiho, and Hyun, Jin K., (1998), International comparison of the black economy: Empirical evidence using micro-level data, Unpublished paper, Presented at the 1998 Congress of the International Institute of Public Finance, Cordoba, Argentina.